
Methane Monitoring
An ESG-grade methane emissions dashboard, live.
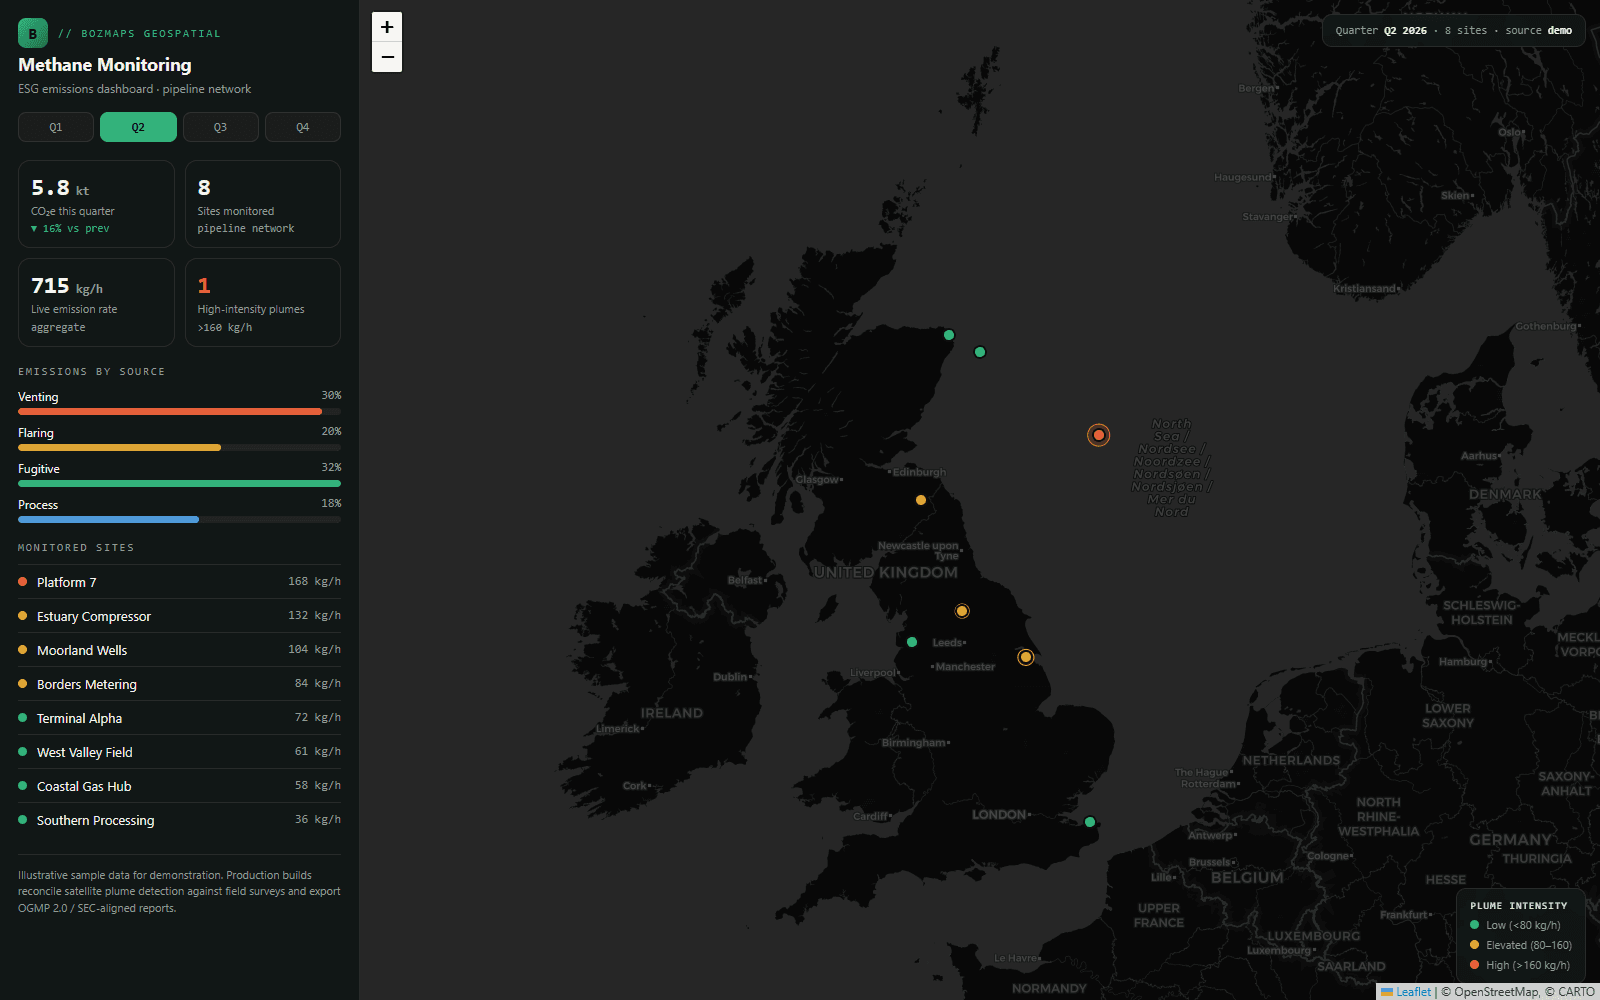
What we built
An interactive ESG monitoring dashboard for a pipeline network: a dark facility map with plume markers sized and coloured by emission intensity, quarter-on-quarter KPIs, a source-category breakdown and a ranked site list, all switchable by quarter. Built with Leaflet on open CARTO basemaps. This is a working demo running on illustrative sample data, the pattern production builds use to reconcile satellite plume detection with field surveys and OGMP 2.0 reporting.
Highlights
- Facility map with plume markers sized by emission intensity
- Quarter-on-quarter KPIs, source breakdown and ranked sites
- Interactive demo on sample data, Leaflet on open basemaps
About this engagement
Category: Map & Dashboard · Sector: Energy & ESG · Status: Demo · Year: 2026
See it live at methane-monitoring.vercel.app.
How it was built
Like every project at BozApps, this was designed, built, deployed and (where the engagement included it) operated end to end by the same person. Production defaults such as TypeScript strict, row-level security on the database, structured logging, accessibility audits, schema.org structured data and GDPR-compliant cookie handling are included from the start, not added at the end.
If you have a project that looks like this one and would like a similar build, get in touch. We come back within a working day with a written, honest view on scope, timeline and cost.
Want a similar build?
Tell us about your project. Reply within one working day, written proposal within five.